Looking for a quick visual report that will reveal at-a-glance information about website traffic that is at a low point in the sales funnel? Use Google Analytics’ custom reporting to generate a simple, high-level report that will highlight the source of this important segment. Keeping it simple, will allow you to quickly zero-in on important prospects in the late stages of the sales process and avoid the thrashing that can sometimes come from deep data dives.
According to JD Powers, over the last four years there has been a 70% increase in the number of new car shoppers who use a mobile device (Smartphone or Tablet) in their research [i]. This translates to half of all shoppers. Further, the same study revealed that of those using a mobile device, roughly 1/3 used a smartphone, 1/3 used a tablet and 1/3 used both. This massive growth not only underscores the importance of responsive website design, it gives a unique opportunity for auto dealers to zero in on this distinct and identifiable segment of their website traffic.
Research shows that 48% of smartphone users are accessing pricing information while at the dealership [ii]. Furthermore, 19% disclosed they are using this information in the negotiation process to get a better deal [iii]. While this reveals the necessity of a robust inventory management solution that will ensure accurate and consistent pricing information, it also illustrates an indirect way for dealers to back into the source of this very important traffic segment. Armed with this information, the allocation of marketing spend will gain another level of accuracy.
While there are a variety of tools to measure website traffic, and a myriad of reports within these tools, there is a simple custom report you can build in Google Analytics to highlight this information quickly. By making a quick change to the report display, dealers can produce an at-a-glance report that reveals this information quickly and efficiently.
Google Custom Reports may sound intimidating at first; however, following the steps outlined in the screen shots below will give the dealership’s executive team an easy-to-read report highlighting the campaign level source of your mobile traffic (desktop and tablet too). Given the buying behavior associated with mobile traffic, understanding where this traffic originates from will help provide insight on how to maximize this channel.
First, to build the custom report: 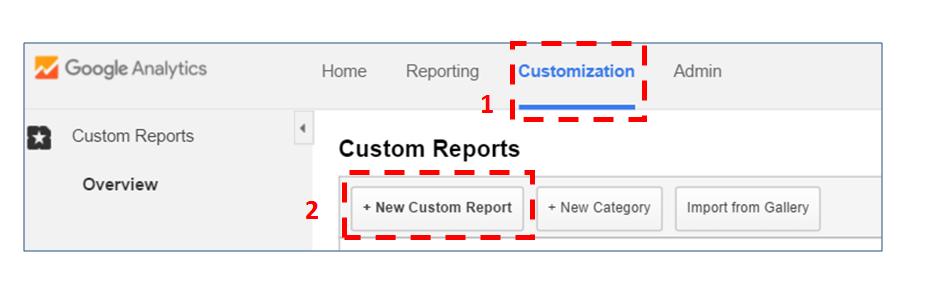
- Access the custom reports menu
- Select “New Custom Report”
- Name your report
- Name the metrics group (optional)
- Select the following Metrics: Sessions, % New Sessions
- Add the following Dimension Drilldowns: Device Category, Medium, Source, Campaign
- Select Save

Second, select the new report from your list of custom reports and make the following changes to the display options:
- Adjust the date to the period you wish to analyze
- Change the report from tabular to a pie chart
- Because of the dimensions you added when you created the report, you can drill-down to each of your categories. After selecting mobile traffic, you will be able to drill in to that category to analyze the different medium, source and campaign level data.
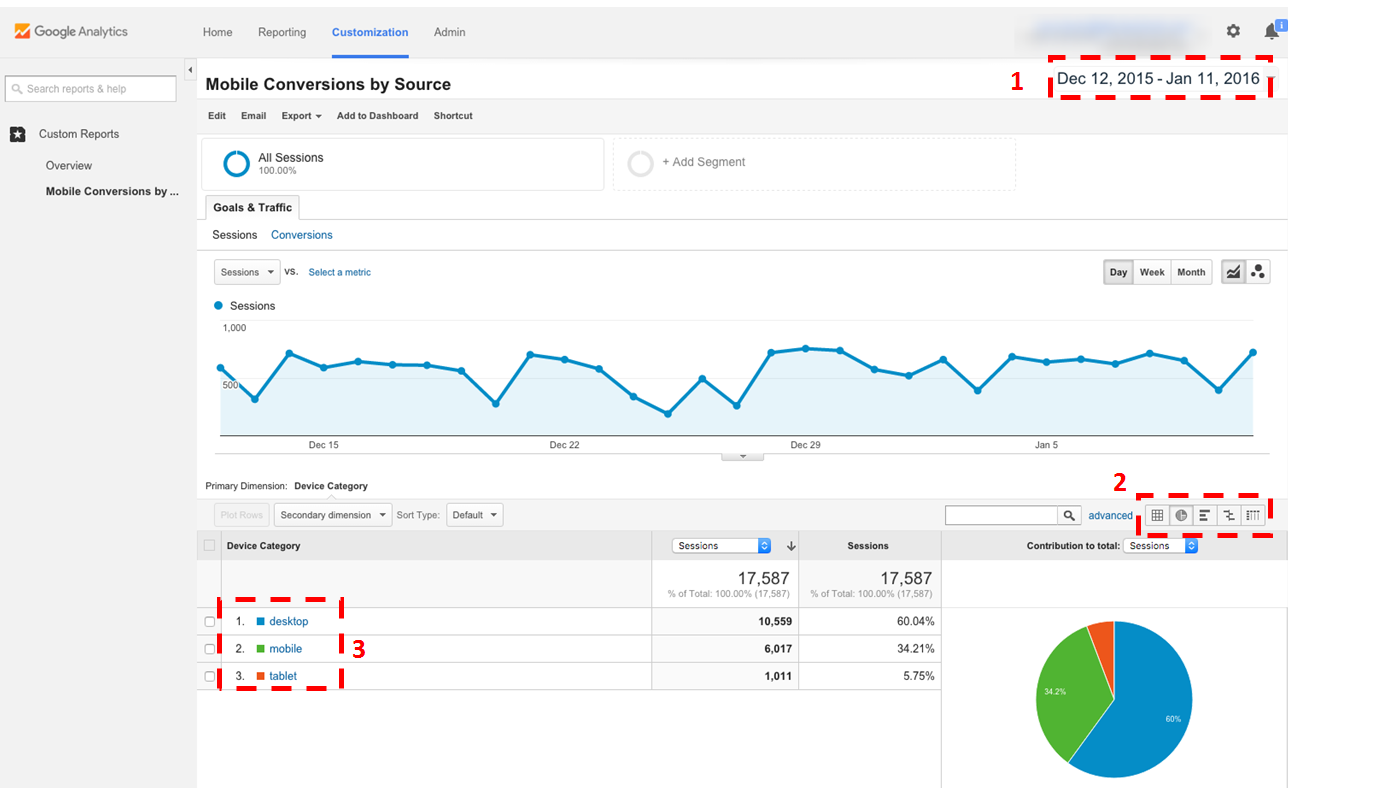
Armed with this information you will now be able to allocate marketing spend as appropriate to maximize mobile traffic.
[i] Arianne Walker, JD Power, “This Is The Future: The Impact of Digital on Automotive Buying,” 2015
[ii] Ibid
[iii] Ibid